Flows: Automation reports
If you're using automations, create and view detailed automation reports, and see how your automations have performed over a period of time.
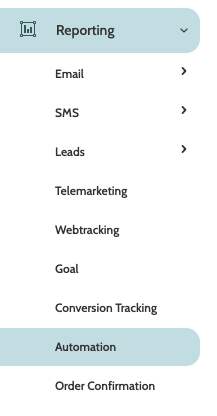
Automation reports can be found under the Reporting menu.
In the navigation page, begin building your report with the filters:
- Filter: Automation: expand the menu and select which automation you wish to generate the report
- Date: use the date picker to choose a custom or preconfigured date range for your report.
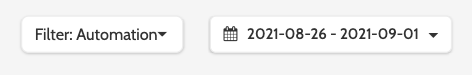
Click Apply to view the report.

Automation reports are made of two sections: the top graph is the segment that your chosen automation is built on.
The bottom graph is the automation activity that has been scheduled to be sent to the leads in the segment.
In each you can view how many ledas were in each event for the chosen period of time, along with a graph representing automation activity.
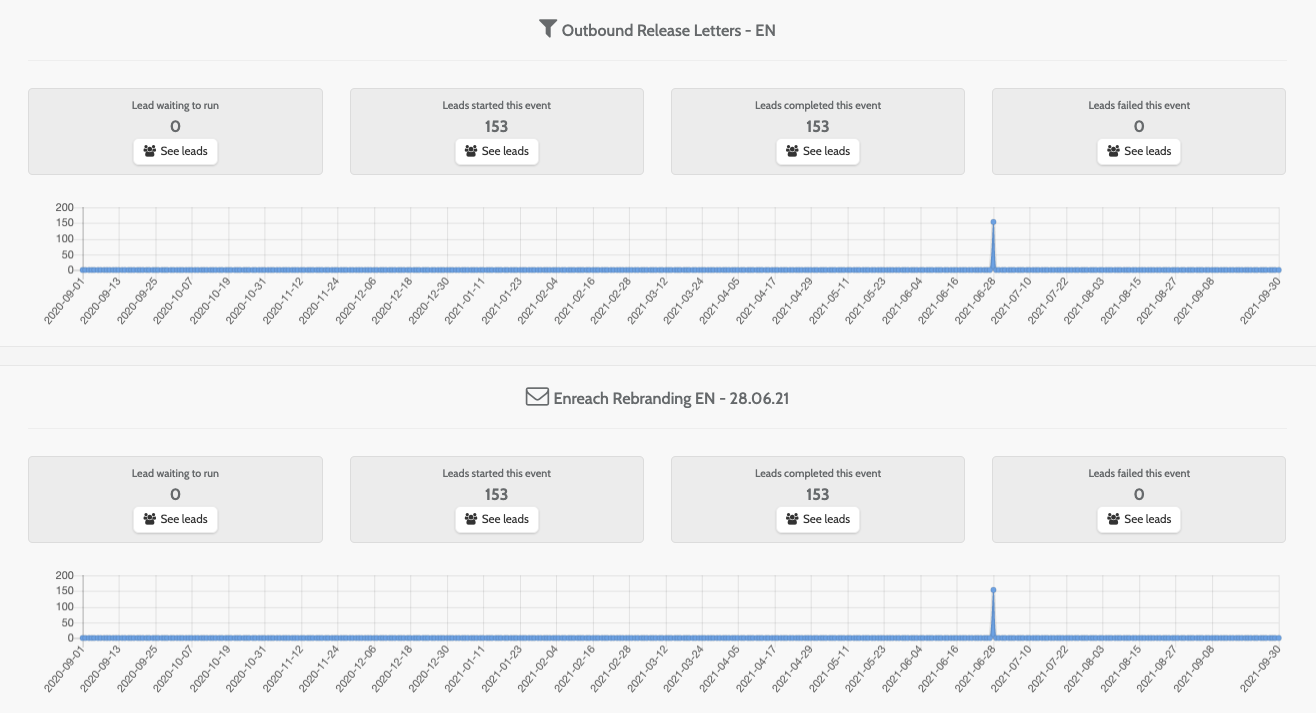
To view the leads in each event, click See leads.
The leads will be displayed in a pop-up window.
Click the Lead ID in the ID column to be taken to the Lead overview page. Here you can view and edit lead details.
For more information on the Lead overview page, head to this article.
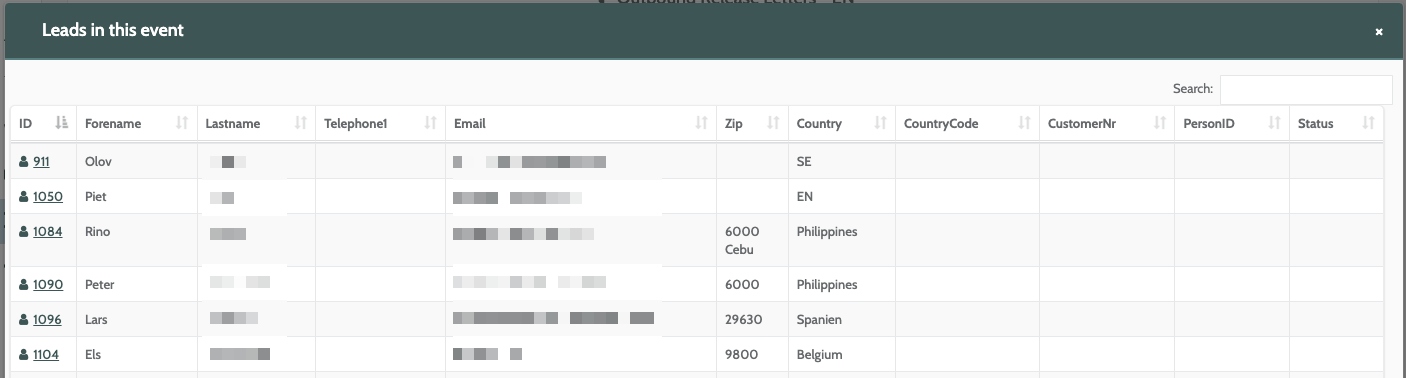
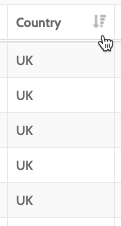
Click a column header to rearrange the leads by group or in alphabetic or numerical order.