
Flows: Leads reports
With lead reports you can create and view reports for all your lead activities, check lead movement through Lifecycle statuses, and see how well lead sources are performing.
Lifecycle report
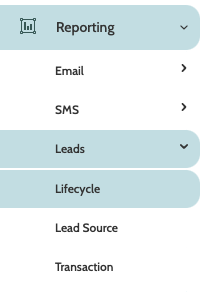
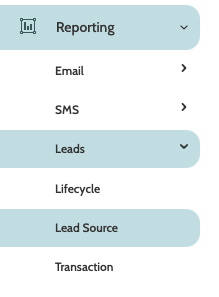
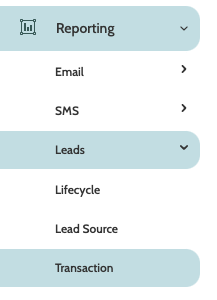
Leads reports can be found under the Reporting menu.
Under Leads there are three options for viewing reports: Lifecycle, Lead Source, and Transaction.
Lifecycle reports will allow you to generate detailed reports of how many leads have moved through Lifecycles over a given period of time.
Begin building your report with the filters:
- Filter: Lifecycle: filter the report by Lifecycle status
- Filter: Exclude stoplists: filter the report by excluding stoplists. Select one or more to be excluded
- Date: use the date picker to choose a custom or preconfigured date range for your report.

Click Apply to view the report.

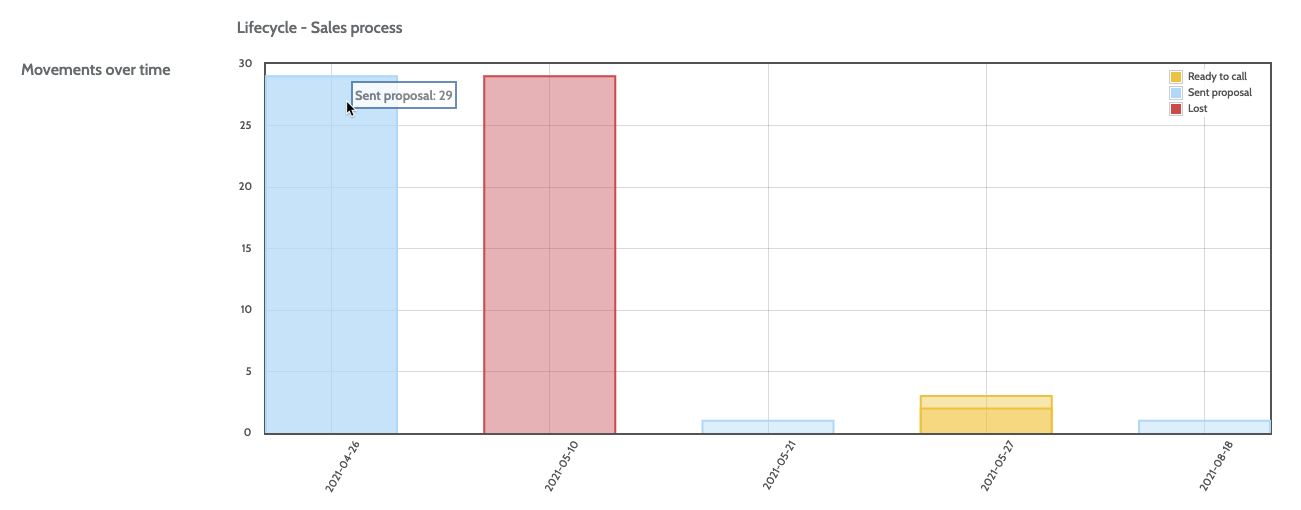
In the first part of the report you will see Movements over time - a bar chart containing all of the Lifecycle statuses chosen in the report filters.
Columns are colour coded according to the legend in the right. Hover your cursor over a bar to see how many leads are in each Lifecycle status for that period of time.
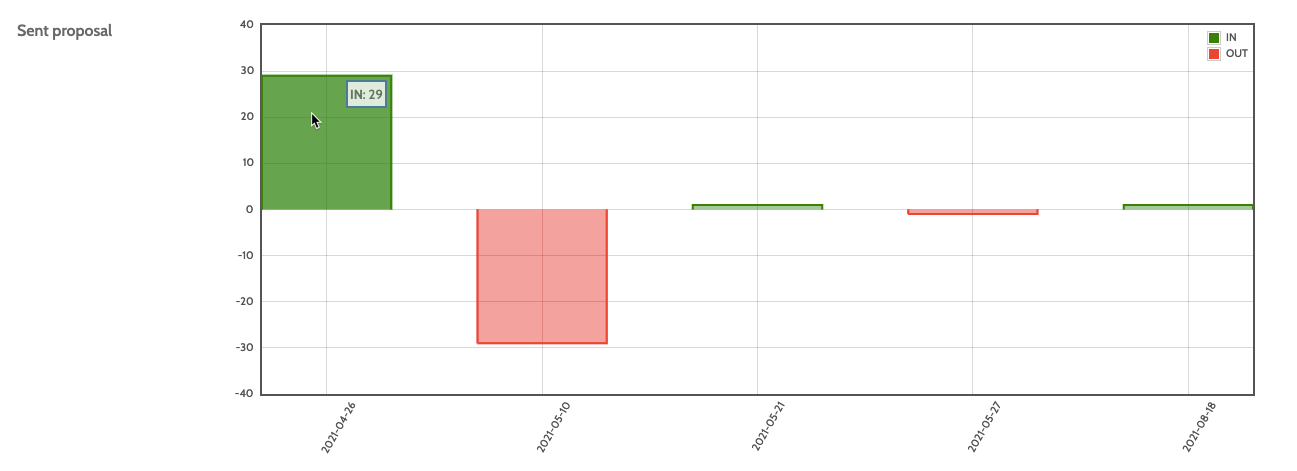
Further down in your report you can view bar charts of each separate status within the Lifecycle, and their activity over time.
Lead source report
Lead source reports will allow you to generate reports on how your lead sources are performing, and how many leads are being requested, accepted, and rejected.
In the navigation page, begin building your report with the filters:
- Group 1: select a category, or Group, to be included in the Details report chart
- Group 2: select a second category to be included.
- Filter: Sources: expand the menu and select the lead source(s) you want to generate a report for
- Date: use the date picker to choose a custom or preconfigured date range for your report.

Click Apply to view the report.
In the first part of the report, view numerical and statistical data for all requests in your chosen period of time, and a line graph of the development over time. Hover your cursor over a marker to see the lead source development for that period of time.
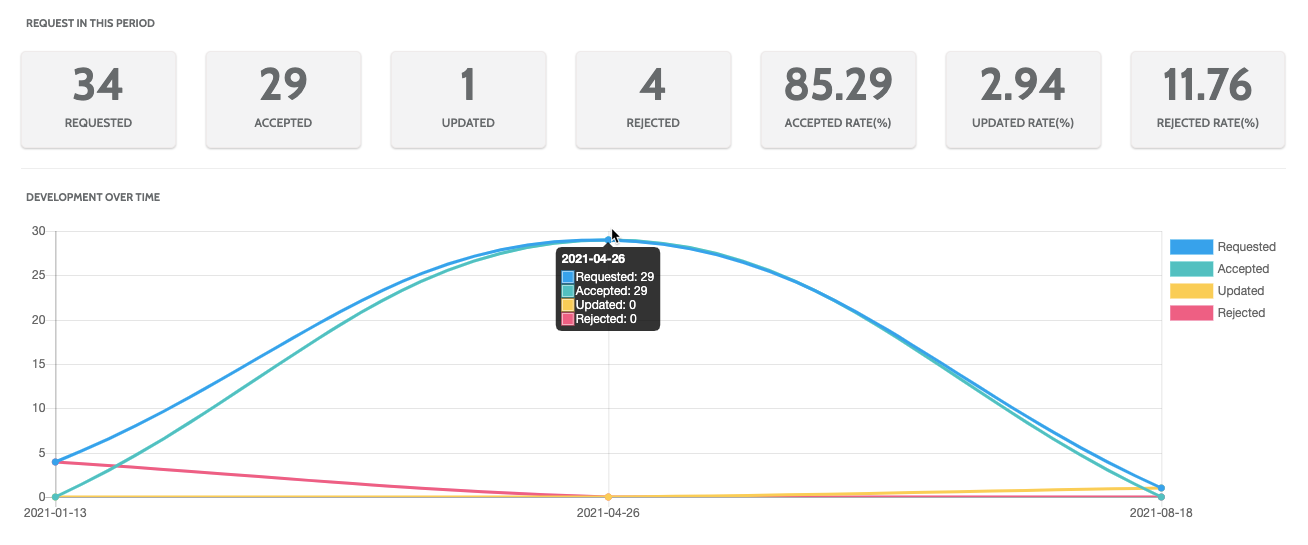
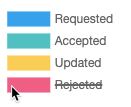
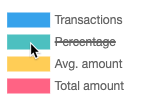
To edit the graph, click on the categories to the right to remove them from the view.
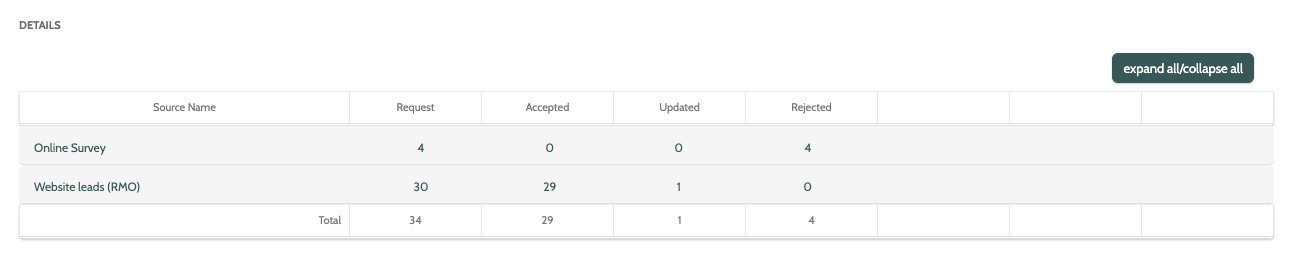
Under Details, view a detailed breakdown for Group 1 and Group 2 you included in report filters.
Click each heading, or Expand/collapse all to expand a list of the data in numerical and percentage form.
Click Option to expand a list of options when working with the report.
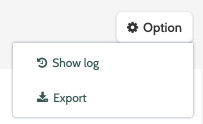
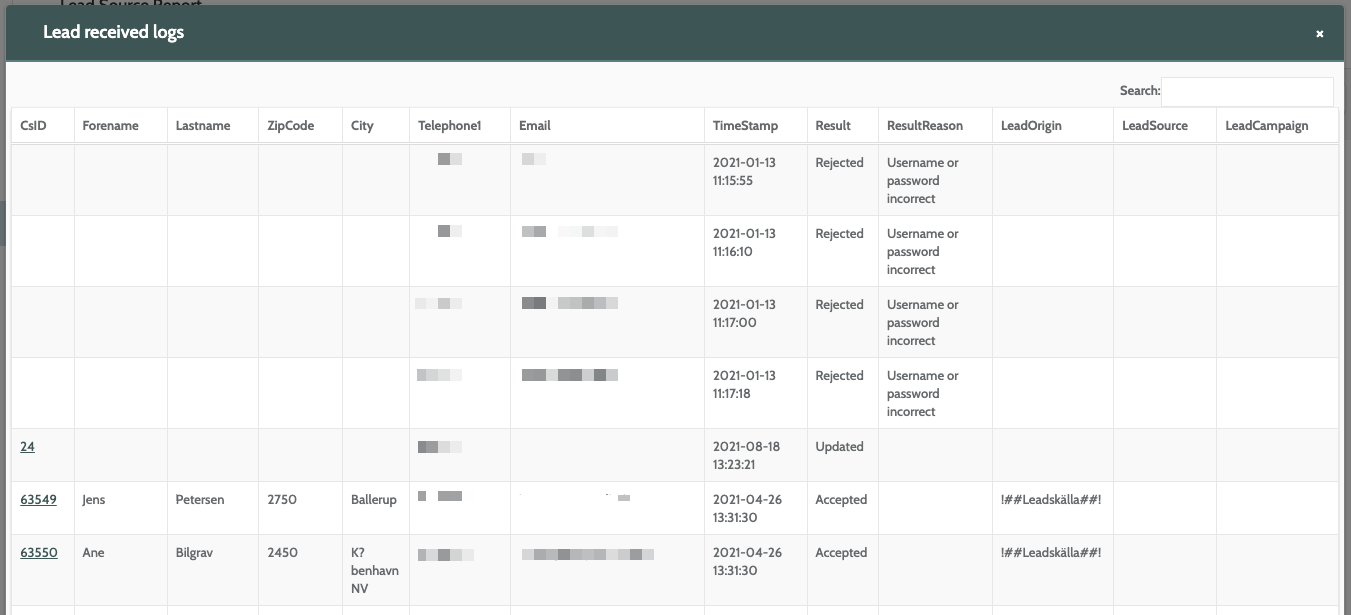
Click Show log to view to view a detailed log of all leads received, including the lead CsID, the result, and and lead origin.
Click Export to export the report as a .CSV file to your desktop.
Transaction report
Transaction reports will allow you to generate reports on any transactions in Flows.
Please note that you must have already created Transaction Types to use transaction reports.
In the navigation page, begin building your report with the filters:
- Filter: Saved filters: if you have saved any transaction reports as a filter, select it from the menu
- Filter: Type: filter the report by transaction type
- Group 1: select a category, or Group, to be included in the report
- Group 2: select a second category to be included
- Group 3: select a third category to be included
- Date: use the date picker to choose a custom or preconfigured date range for your report.

Click Apply to view the transaction report.
In the first part of the report, view a numerical and statistical breakdown of how your transactions have performed in the selected time period, including how many have occurred, the average amount, and the total amount.
Underneath you can view a graph of your transactions development over time. Hover you cursor over the graph points to see the statistics of a certain date.
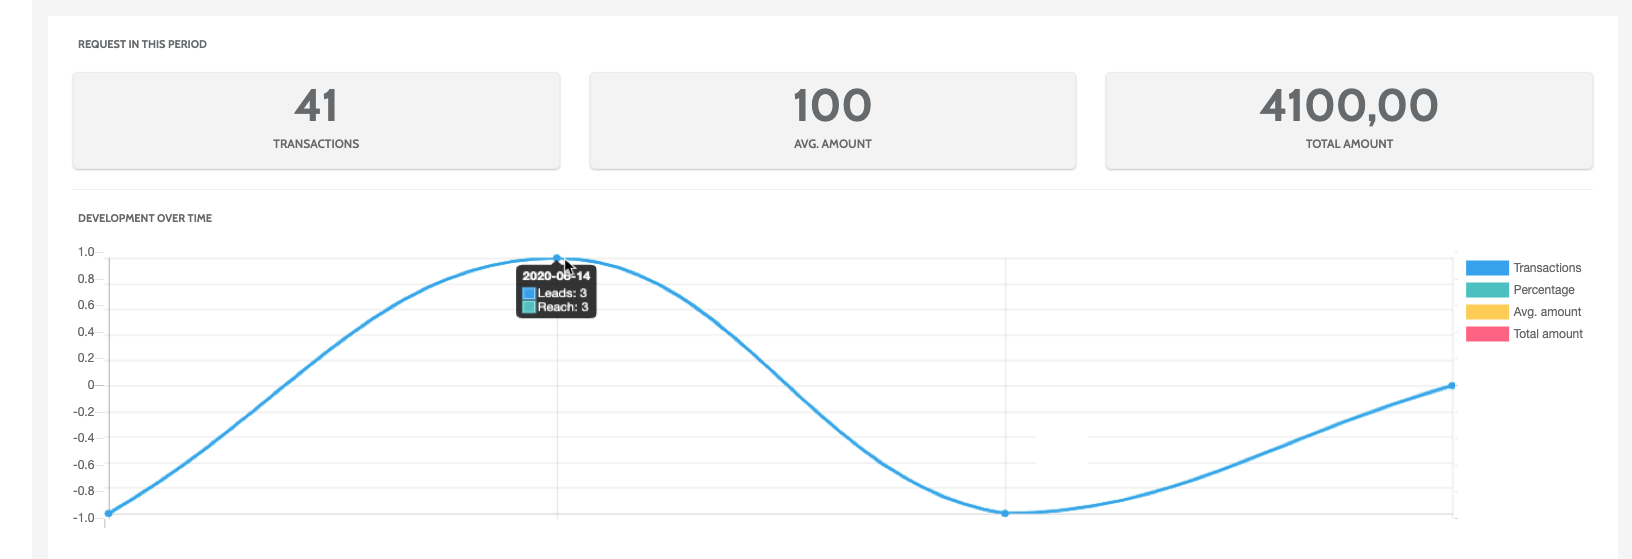
To edit the graph, click on the categories to the right to remove them from the view.
Under Details, view a detailed breakdown for Group 1 and Group 2 you included in the report.
Click each Group, or Expand/collapse all to expand a list of the data in numerical and percentage form.
Click Option to expand a list of options when working with the report.
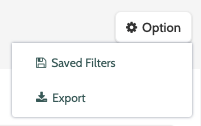
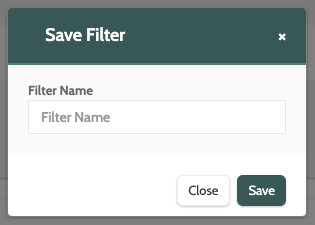
Click Saved Filters to save the report as a saved filter. Enter a name and click Save.
Click Export to export the report as a .CSV file to your desktop.