
Insights: Reports
With reports, custom-make and share reports to monitor the performance of Projects, Campaigns, Teams, and Agents through a large variety of out-of-the-box KPIs, and your own custom KPIs built with the KPI Builder.
Navigation Page
Reports can be found under the Insights menu.
In the navigation page of Reports, you can view all of your existing reports, create and edit new ones, and filter existing reports by a number of different factors.
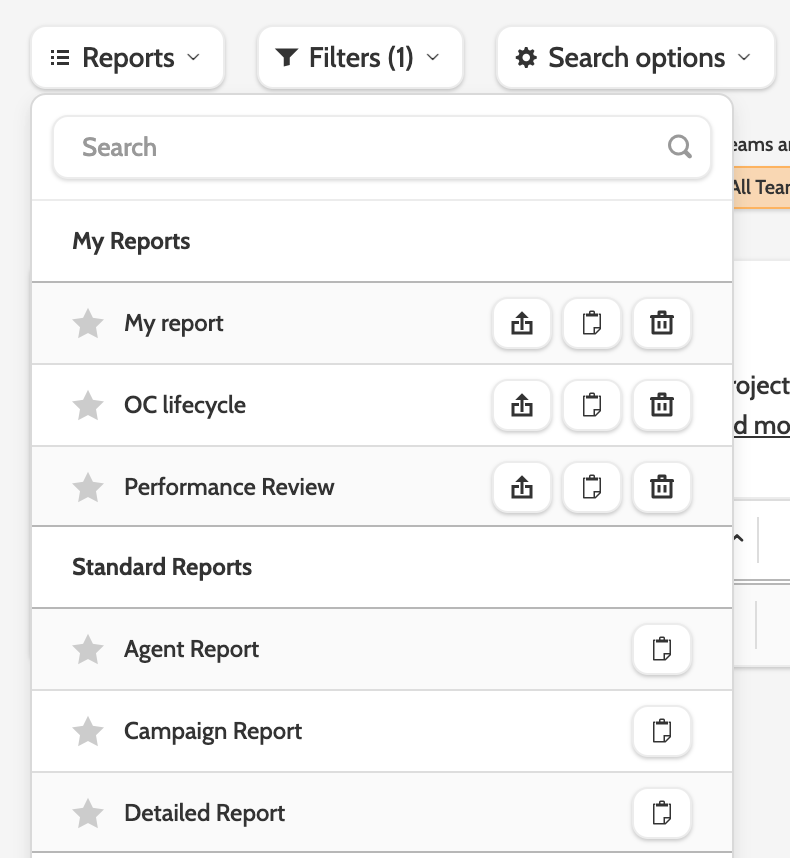
To switch the report view, expand the Reports drop-down menu and choose from a list of reports.
Default reports are displayed under Standard reports, and custom reports under My Reports.
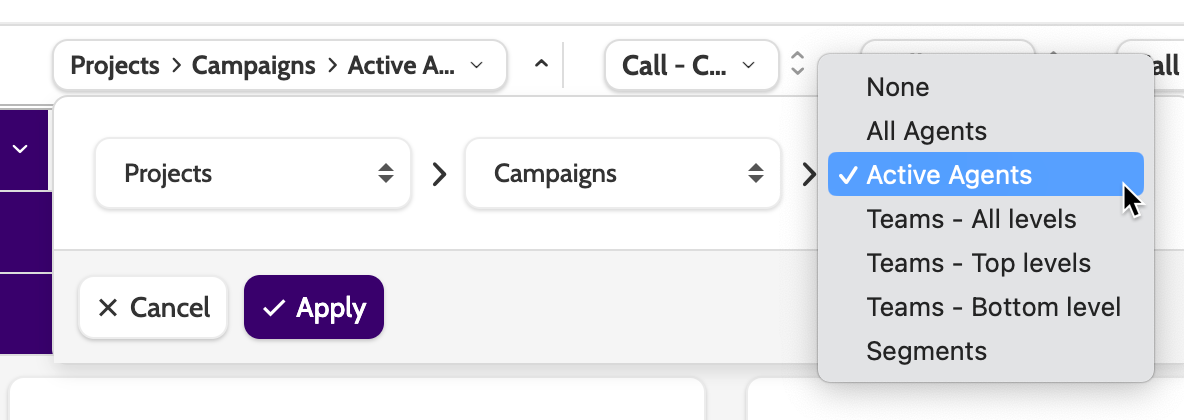
In the report view, the first column is organised by a combination of Projects, Campaigns, Segments, Teams, and Agents.
You can change the view by expanding the grouping menu to decide how the report data should be grouped.
The categories will be nested, and can be expanded by clicking the arrow.
All other columns in the report view are KPIs, values that allow you to easily analyse the performance of your organisation.
Need a KPI that isn't listed here? Contact your Customer Success Manager or Support to order a smart KPI that will capture your organisation's reporting needs.
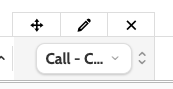
To edit the KPIs, click a column to view the options.
The four-way arrow lets you move the column by drag'n'drop.
Click the pencil icon to edit the name, and the cross icon to delete the column.
To change the display of the KPIs from highest to lowest or vice versa, click the arrows to the right of the name. This will allow you to view the highest or lowest performing grouping according that that KPI.
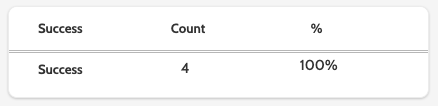
Expanding the User will display three user-specific KPIs: Success, Not Interested, and Failed.
The total call count will be displayed, along with the percentage of total calls made that the KPI makes up.
Standard reports
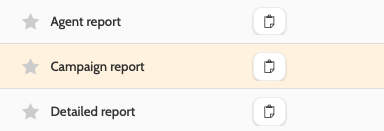
In addition to creating custom reports, Outbound has three default standard reports: Agent, Campaign, and Detailed report.
Expand the reports menu to select a report.
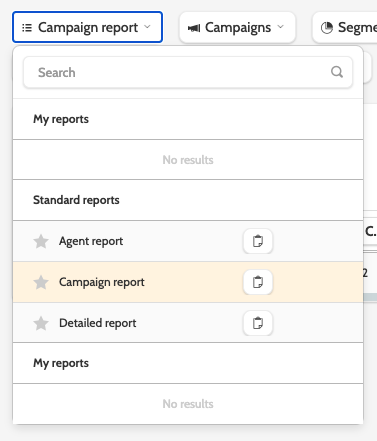
When prompted, click search.
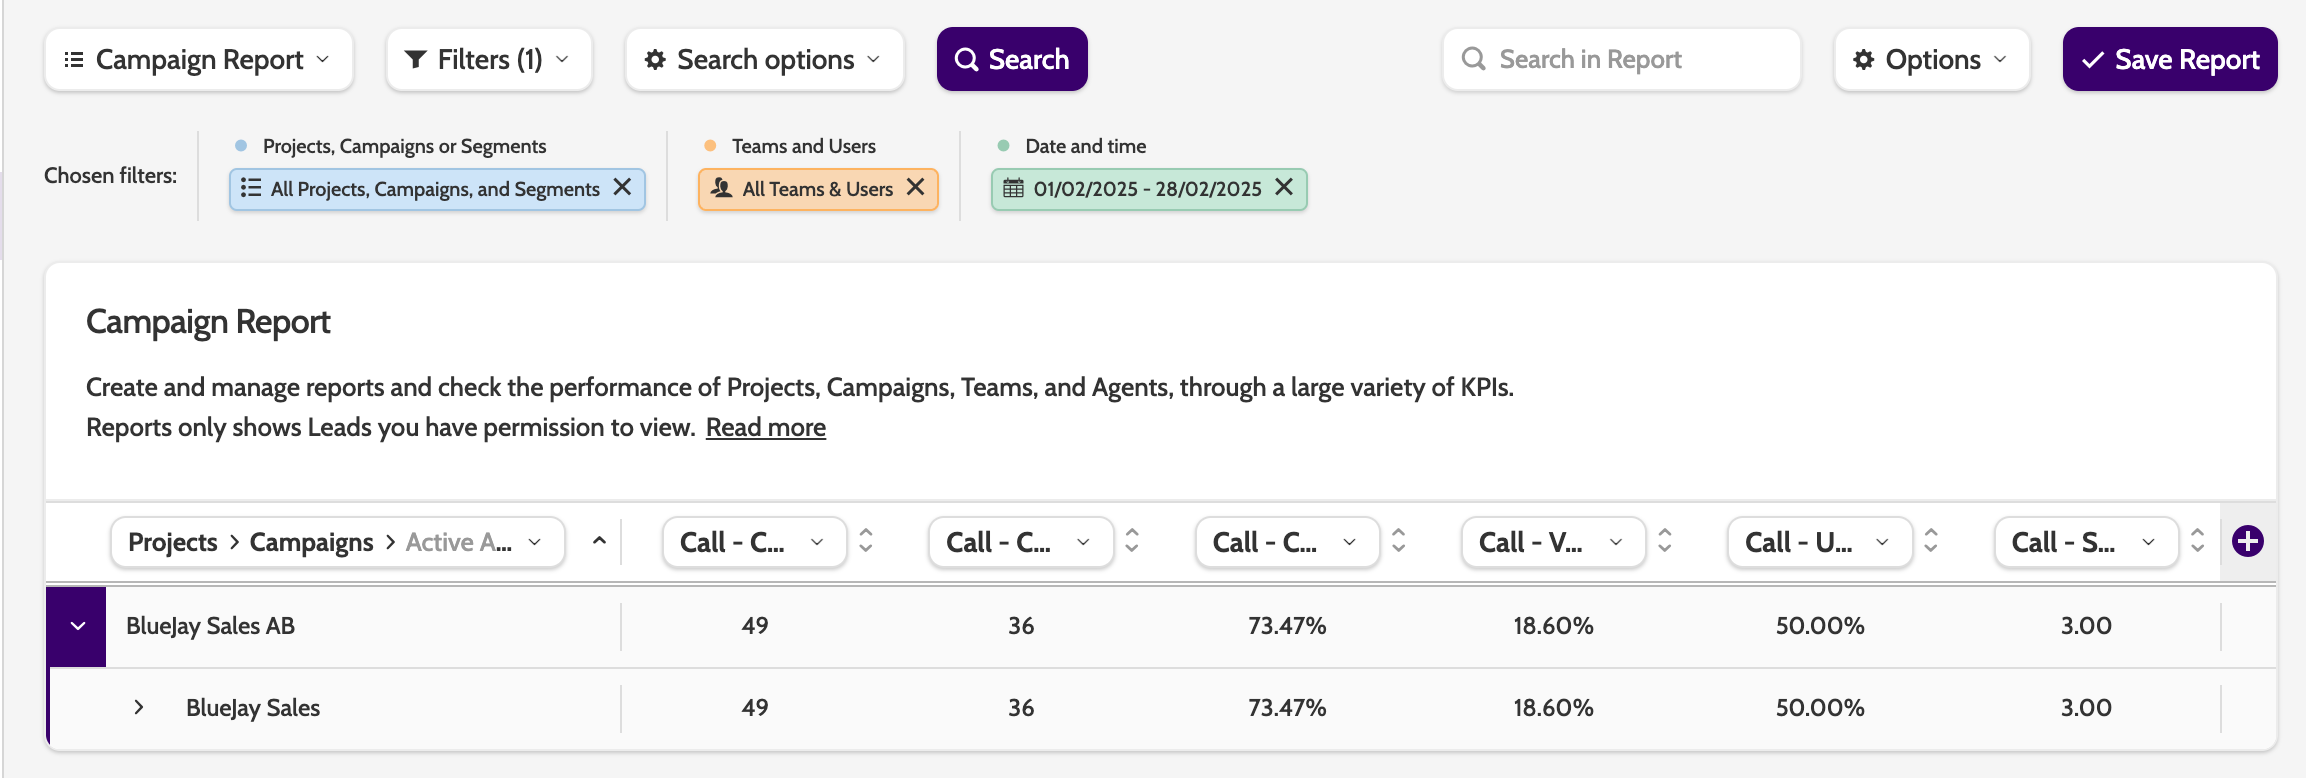
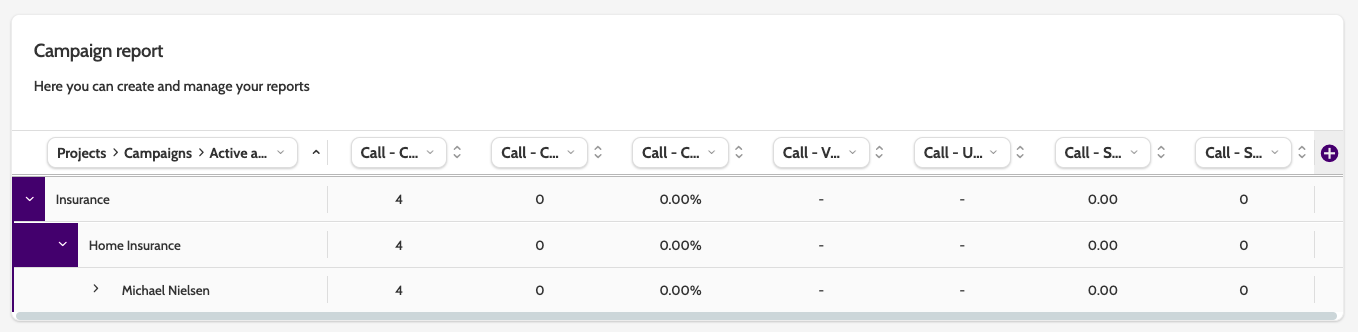
In the image below, the standard campaign report displays all of the default KPIs.
You can see that in the grouping menu, the order is Projects > Campaigns > Active Agents.
This grouping dictates the hierarchy of information displayed in the first column.
As you can see in the image, clicking on the Project (Insurance) arrow will expand the grouping to display the campaigns in that project.
Expand the Campaigns (Home Insurance) arrow and all Active agents working in that campaign will be displayed, along with their KPIs.
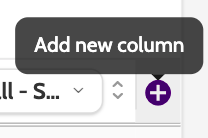
To add a new column to your report, scroll to the end of the columns and click the plus (+) icon to choose from a list of KPIs.
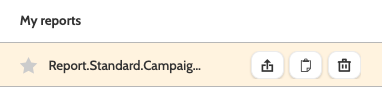
To make a copy click the file icon to the right. Enter a name for the new report and click Save Changes.
You'll find the copy under My reports.
Click the arrow to edit the access rights, the file to create a copy, and the bin to delete.
Create a report
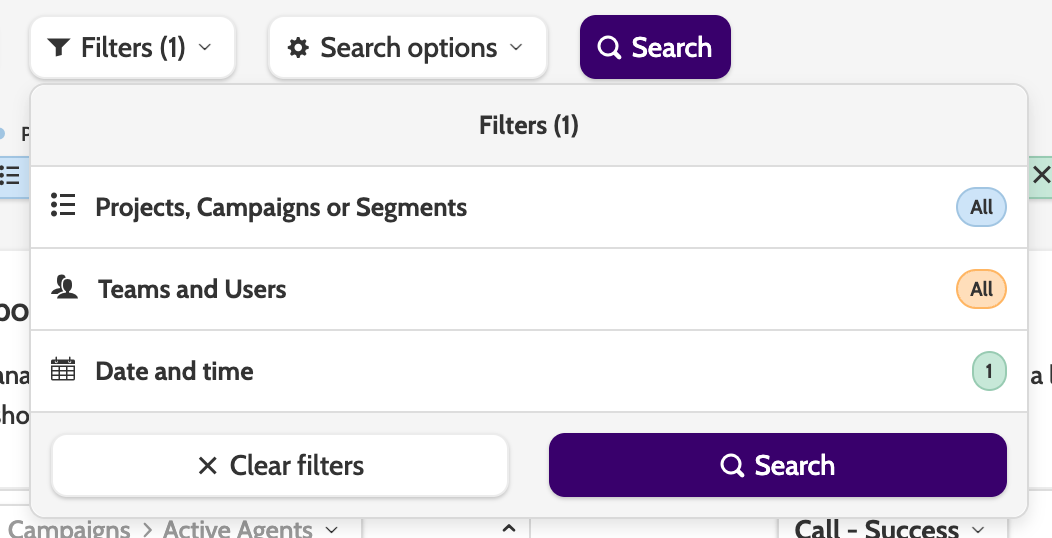
The first step in creating a new report is to decide what data you want to view.
Expand the Filters menu and choose the filters for your reports.
When you have chosen, click the Search button.
To begin adding KPIs to your report, click the plus (+) icon to add a new column.
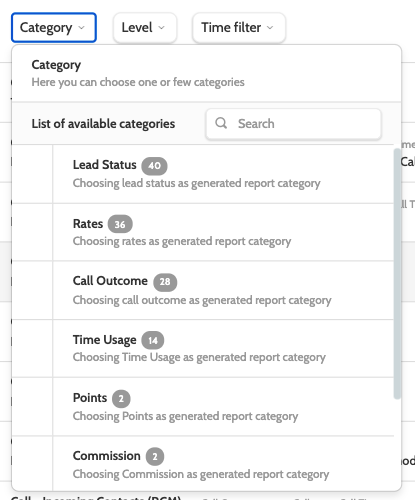
Expand the Select column type menu to choose from a selection of KPIs.
Popular KPIs are listed at top. You can also search or filter on categories to find what you're looking for.
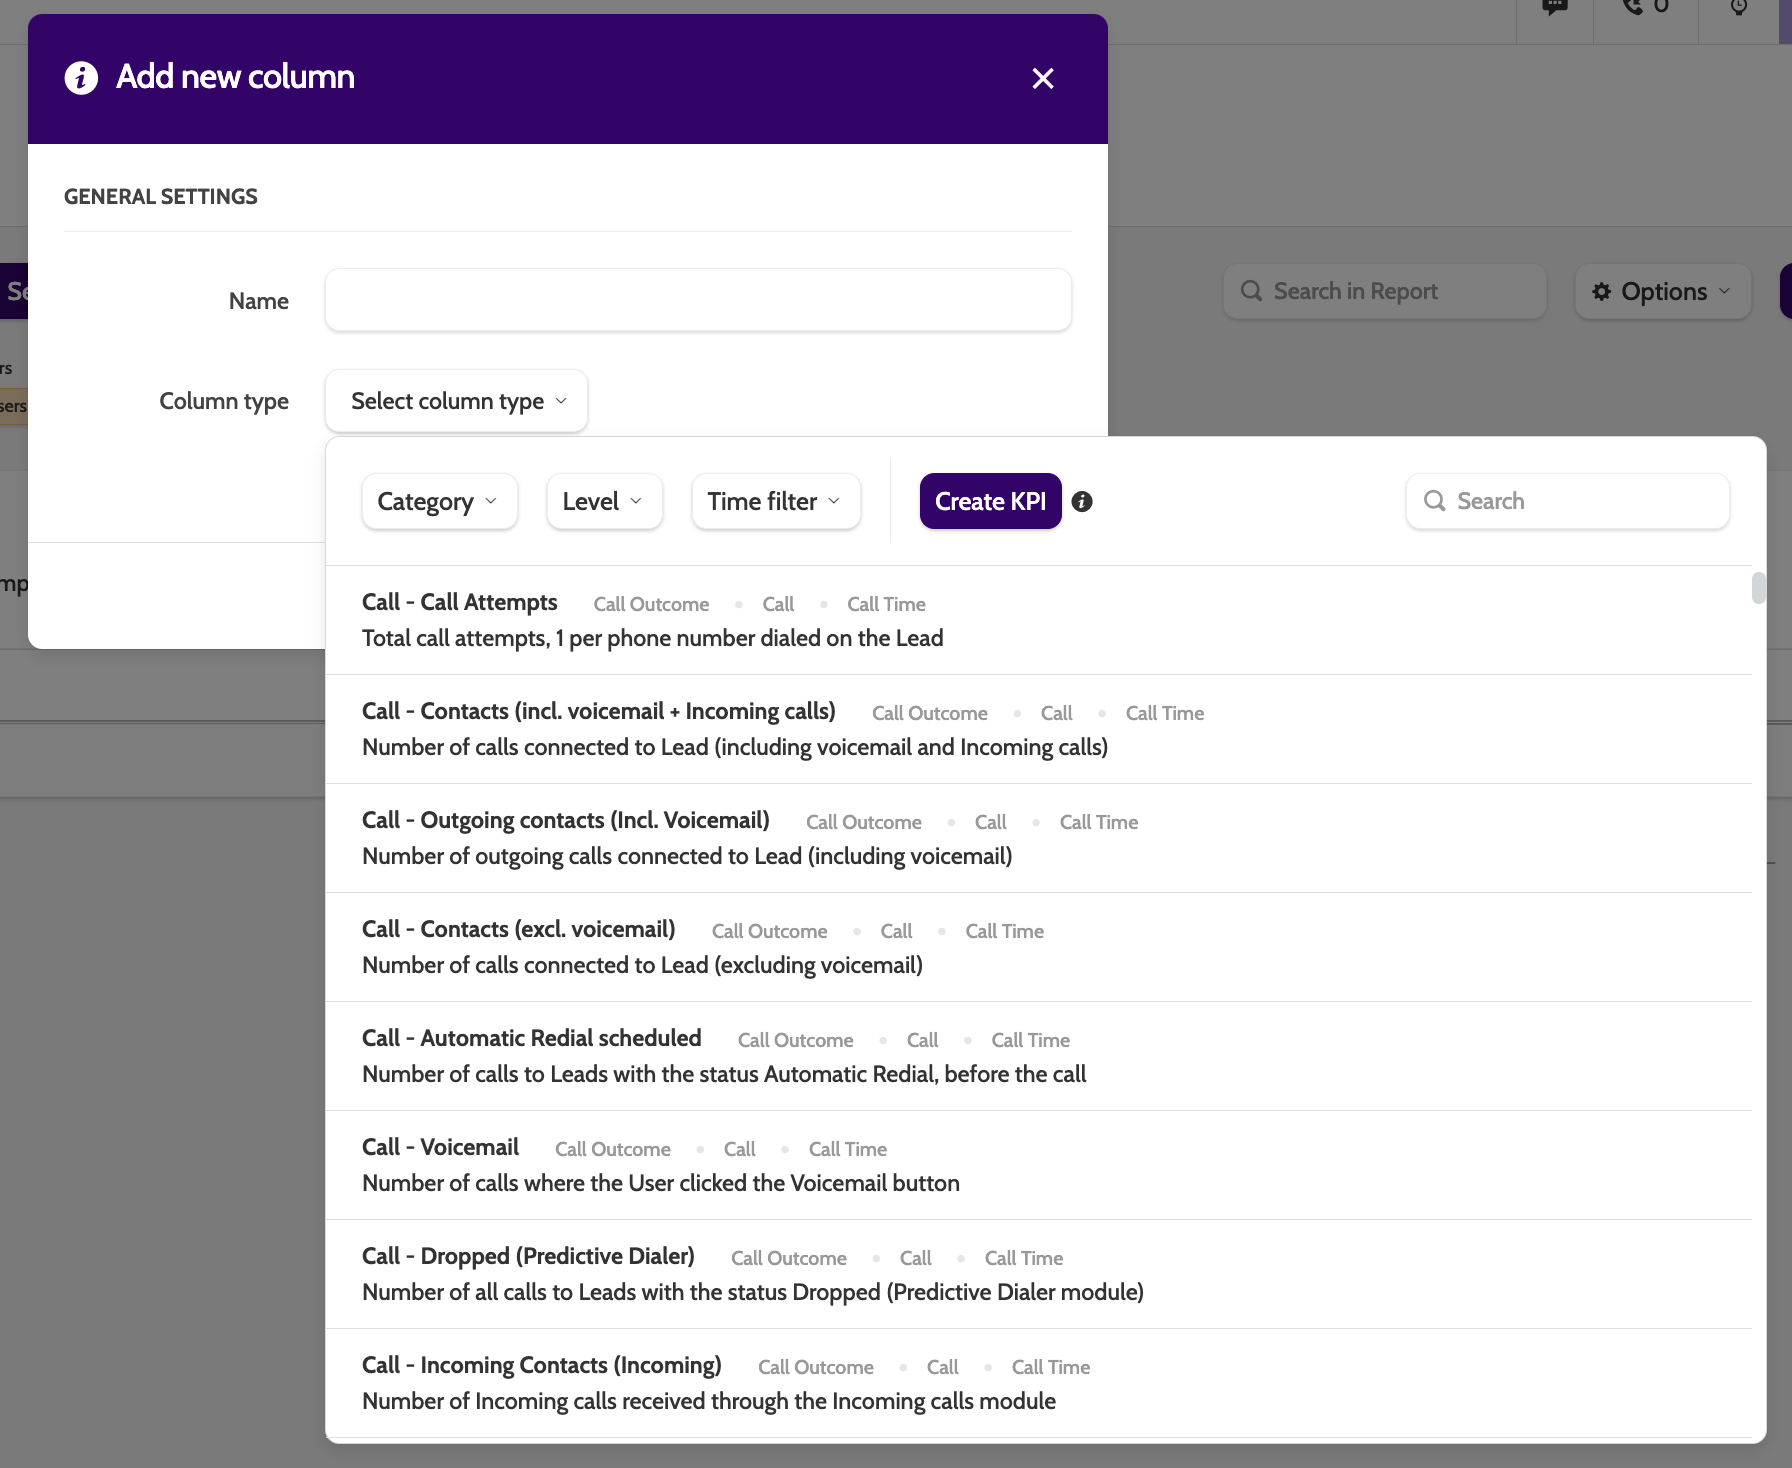
There are currently more than 150 standard KPIs to choose from, so the report possibilities are huge!
KPI Builder
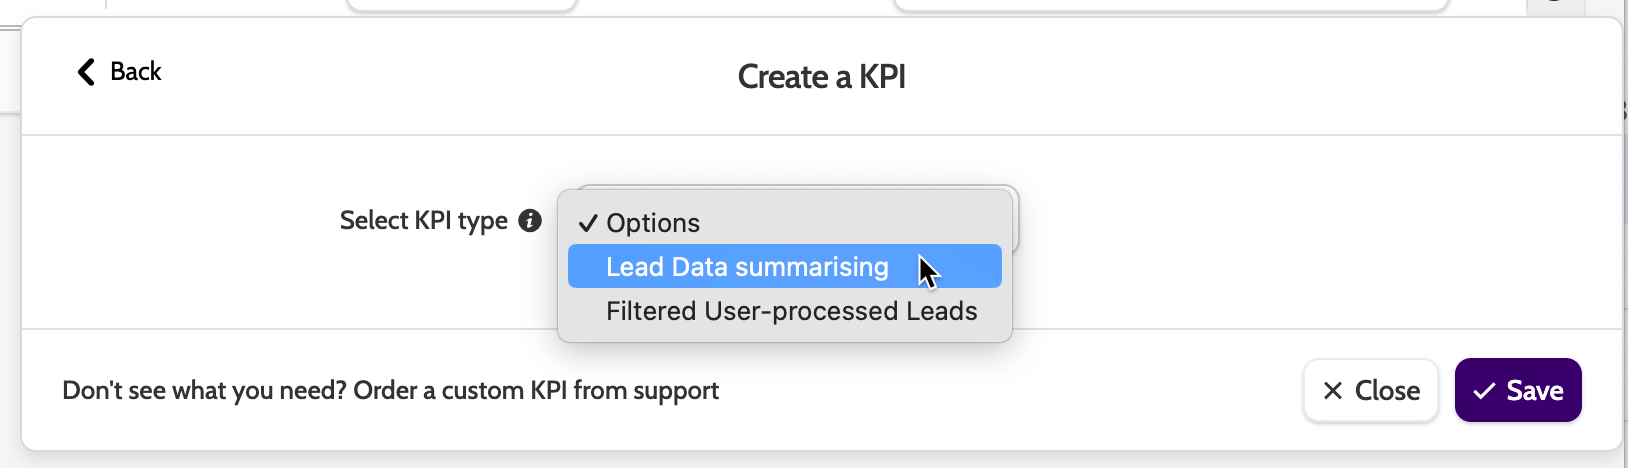
The KPI builder will allow you to create KPIs based on lead data, giving you practically endless opportunities for customising your reporting.
Expand the Select KPI type menu and choose between Lead Data summarising, or Filtered User-processed Leads.
- Lead Data summarising lets you count, sum, and calculate average values from a chosen lead data field
- Filtered User-processed Leads lets you count leads closed with a specific closure, and a specific value in a lead data field you choose.
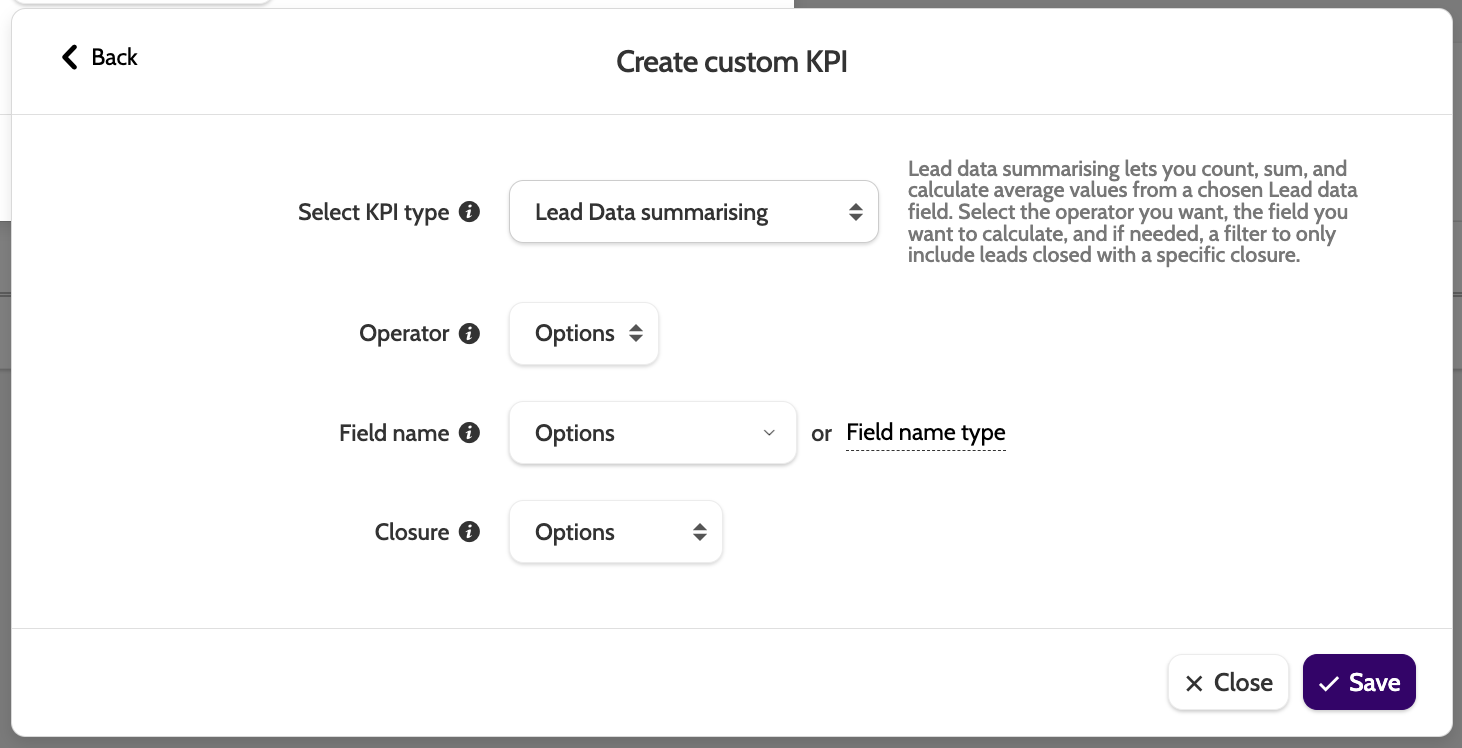
Lead Data summarising
To create a custom KPI with your chosen lead data field, enter the following information in the builder:
- Operator: select how to to calculate your custom KPI
- Average will calculate the average value from your chosen lead field
- Sum will calculate the total sum from your chosen lead field
- Count will count the number of leads that have a value
- Field name: select the custom lead field to build your KPI from
- Field name type will allow you to choose the lead data field category instead. Choose from options such as Commission, Number, and Revenue
- Closure: if you want to filter the results by leads with a certain closure, then select it from the list. Choose between Success, Interested, Invalid, or Unqualified.
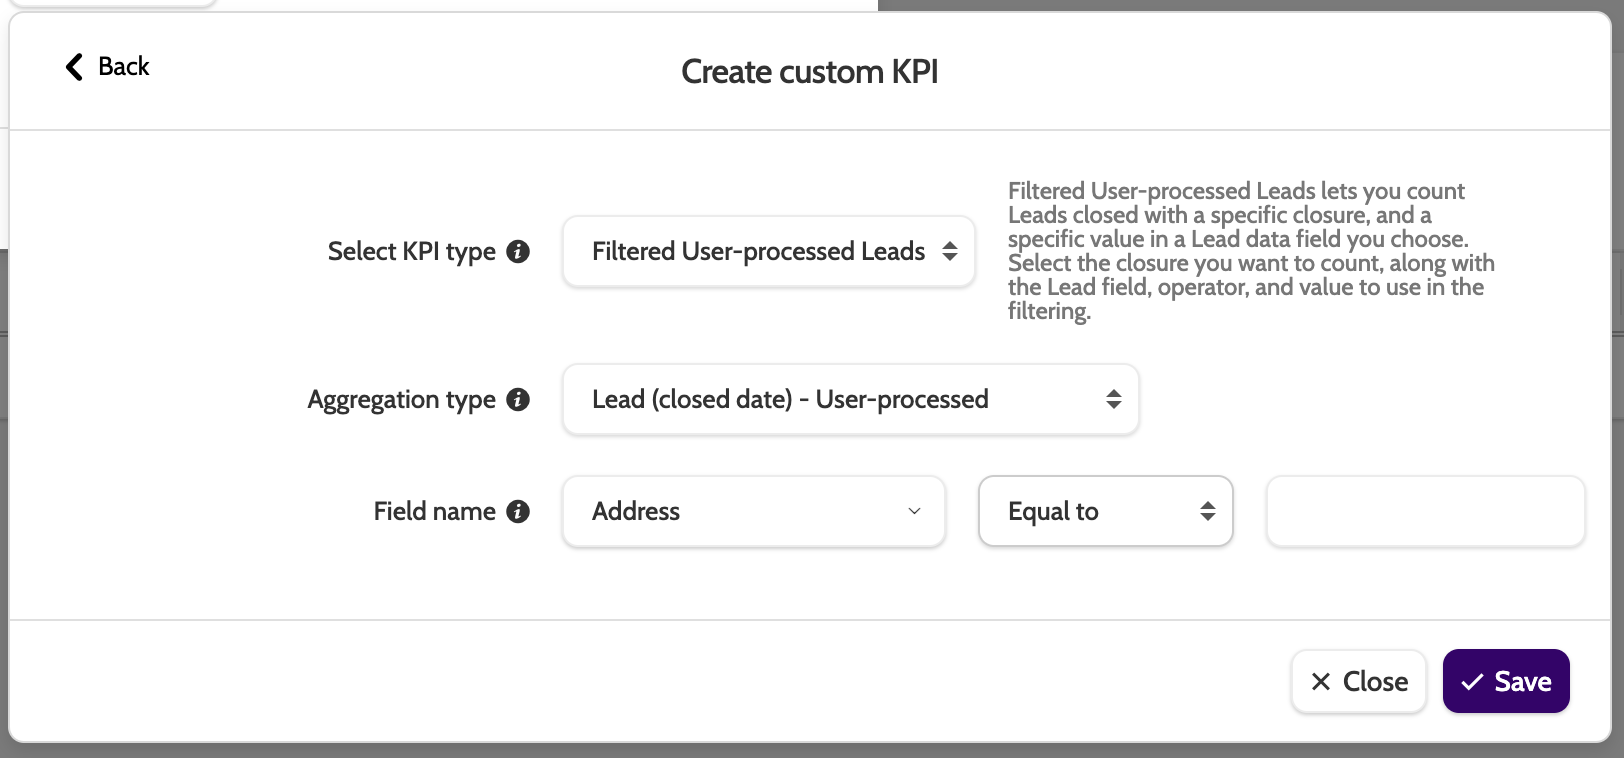
Choosing the option Filtered User-process Leads lets you counts Leads with a certain closure. To start, enter the following information in the builder:
- Aggregation type: choose the type of close you want included in your custom KPI
- Field name: select lead field you want to count. Expand the Options dropdown to choose the operator, and enter the value you want to filter by in the text box.
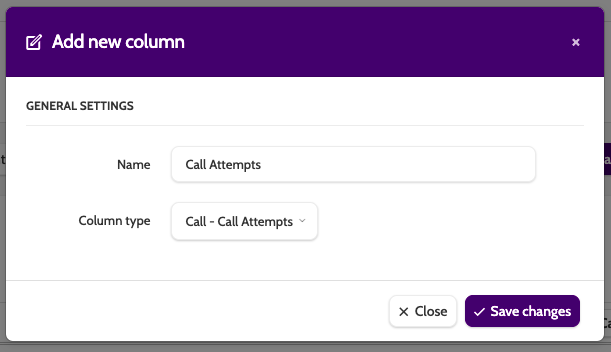
Once you have selected a new column or created a custom KPIs, enter a Name and click Save Changes to save.
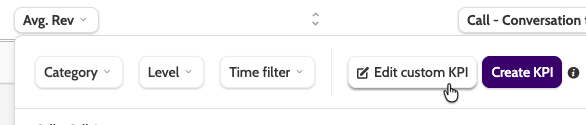
You can edit a custom KPI by selecting it in the report, and clicking Edit custom KPI.
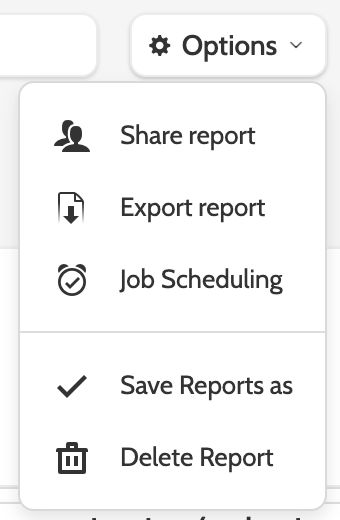
When you have added all your KPIs, expand the Options drop-down menu and click Save report as.
Once the report is saved, clicking Options will give you more options to work with.
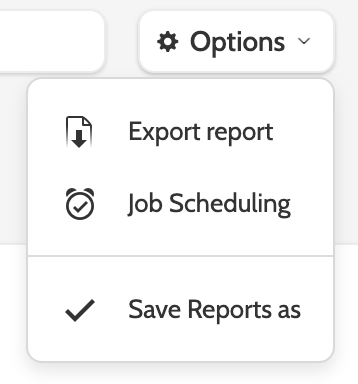
Share with other members of your organisation, Export to download and save the report as an xlsx. file.
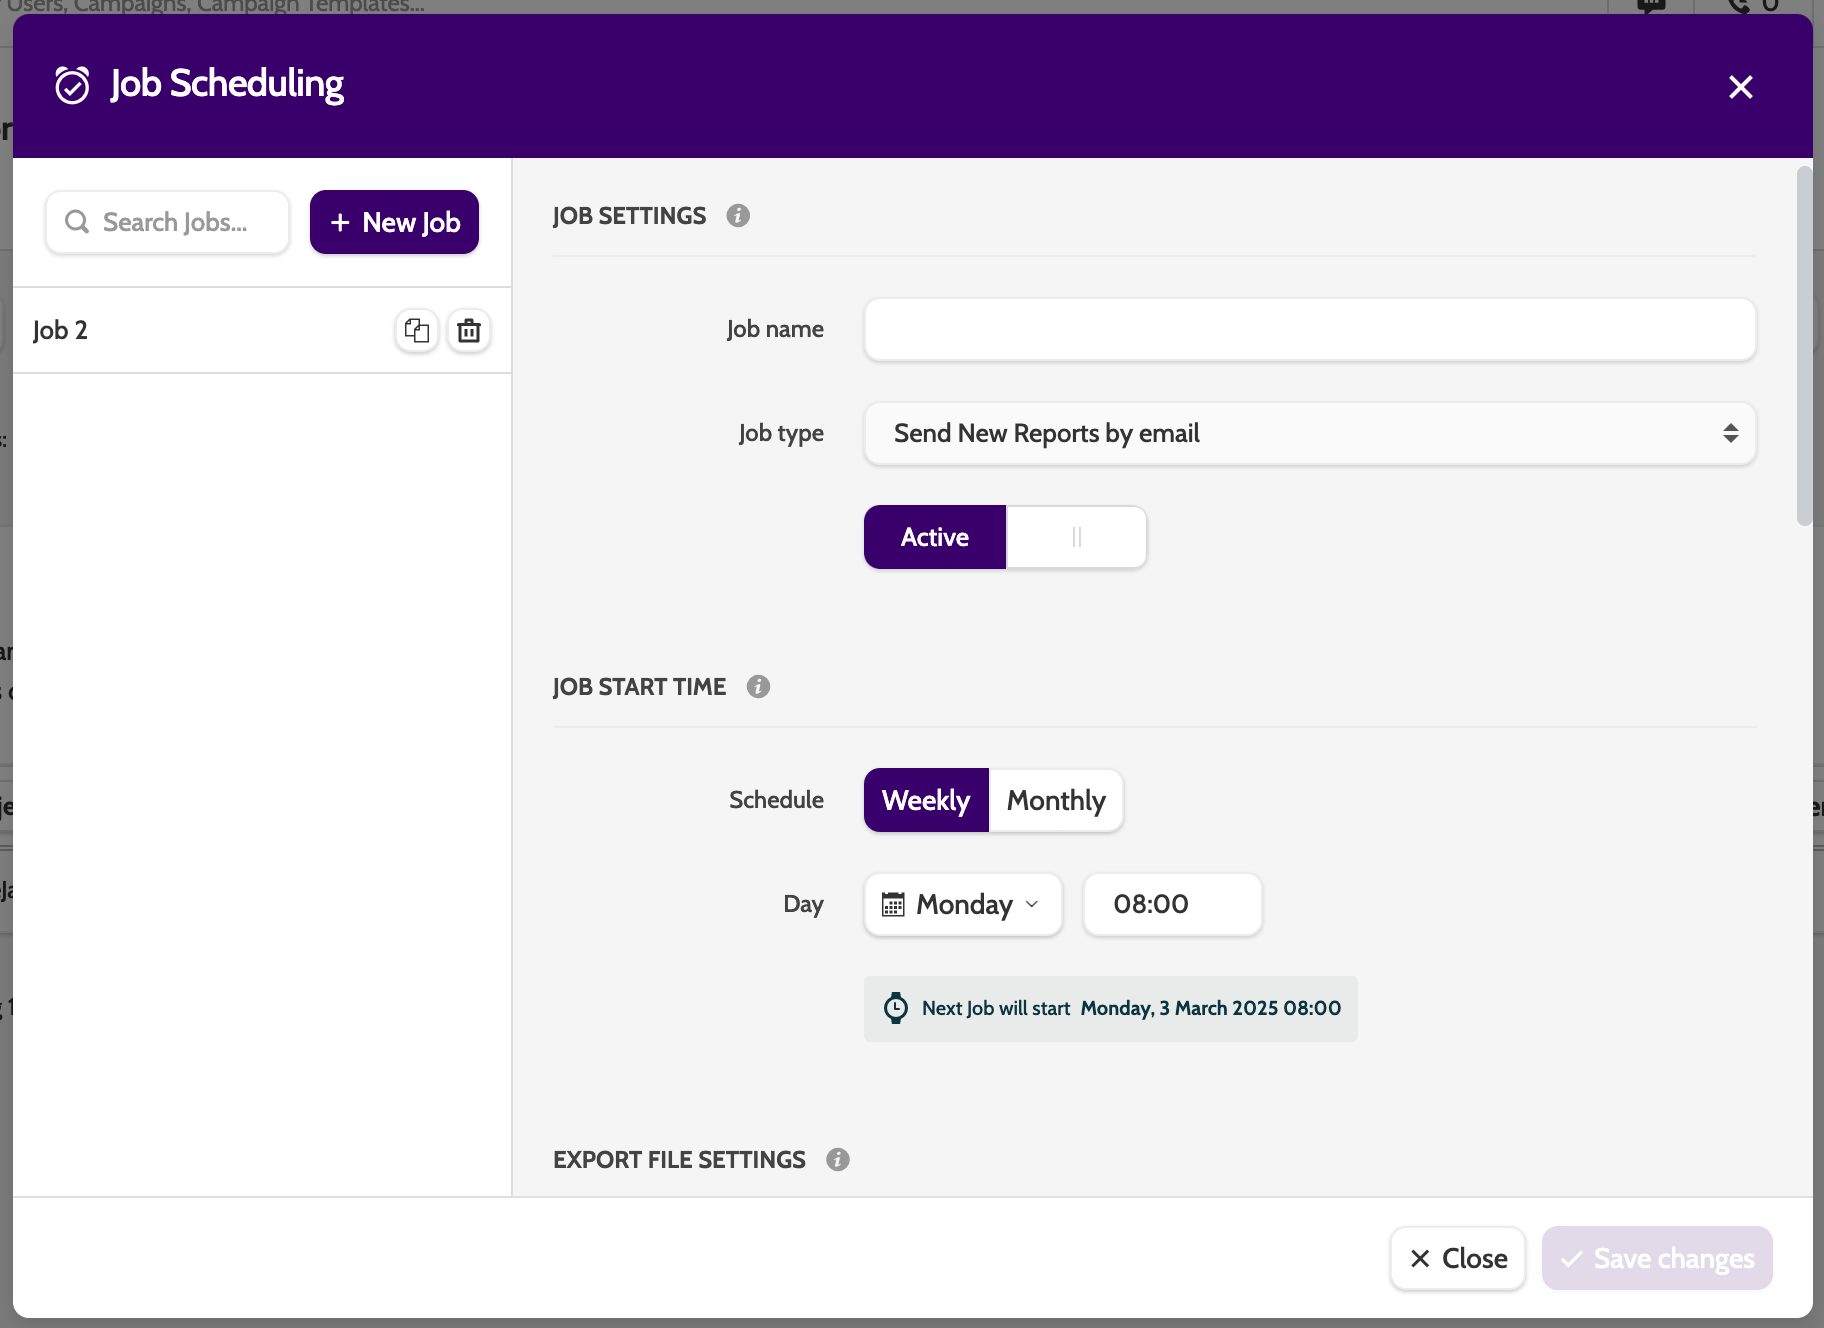
Job Scheduling
With job scheduling, you can set up an automated report to be sent by email to recipients of your choice.
Jobs can be sent weekly or monthly at a certain time, in csv, txt, or xlxs format, password protected, and can include one or several reports of your choice.
FAQ
How is wrap-up time calculated?
Wrap-up time is the amount of time it takes between an agent finishing a call with a lead and entering a lead status.
If an agent is calling to more than one number associated with a lead, then the wrap-up time will include those idle seconds or minutes between calling each number.
In reports, the following KPIs include wrap-up time:
- Call - Revenue per online hour (Successes)
- Call - Points per online hour (Successes)
- Call - Profit per online hour (Successes)
- Call - Commission per online hour (Successes)
- Call - Number of sold units per online hour (Successes)
- Call - Avg. number of Contacts per hour
- Call - Successes per online hour
- Call - User-processed per online hour
- Call - Success + Not Interested per online hour
- Call - Idle time per online time
- Call - Wrap-up time per online time
- Call - Success per Total Hours
- Call - Success + Not interested per Total Hours
- Call - Preparation time per online time
- Call - Conversation time per online time
- Call - Wrap-up Time
- Call - Total time spent on the Contact Page
- Call - Total time spent on the Contact Page (as decimal)
Viewing report statistics for incoming calls?
Please note that when creating a report using incoming calls KPIs, only users that belong to the top team in the organisational hierarchy will be able to view incoming report statistics.
This is because Incoming calls do not belong to an individual user, but the organisation. Therefore only users in the top level team of the organisation will be able to view Incoming call statistics.
Need a KPI that will filter all incoming calls by agent?
Reach out to Outbound support or your Customer Success Manager today.