
Flows: Email reports
With email reports you can create and view reports for all your email activities, and check their performance.
Email reports
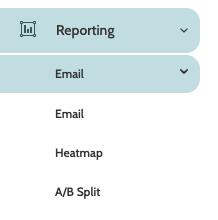
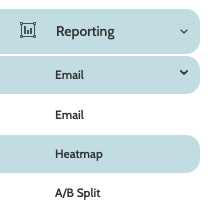
Email reports can be found under the the Reporting menu.
Under Email there are three options for viewing reports: Email, Heatmap, and A/B Split. Click on the desired heading to view the reports.
Email reports will allow you to generate detailed reports of how your emails have performed, and their development over time.
In the navigation page, begin building your report with the filters:
- Tag: if your emails have tags, select the relevant ones from the menu
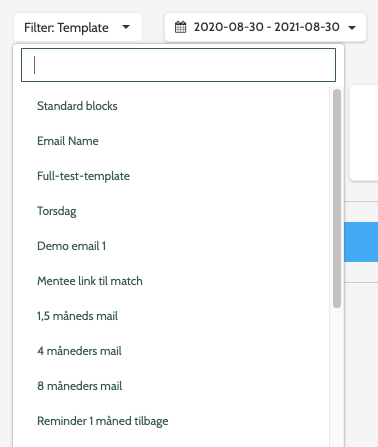
- Template: select a template
- Activity: next, filter the report by email activity, or individual emails sent in Flows
- Group One choose a category, or group, to be included in the Details report chart
- Group Two: choose a second category to be included
- Date: use the date picker to choose either a custom or preconfigured date range for your report
Click Apply to apply the filters.

Your report will automatically generate.
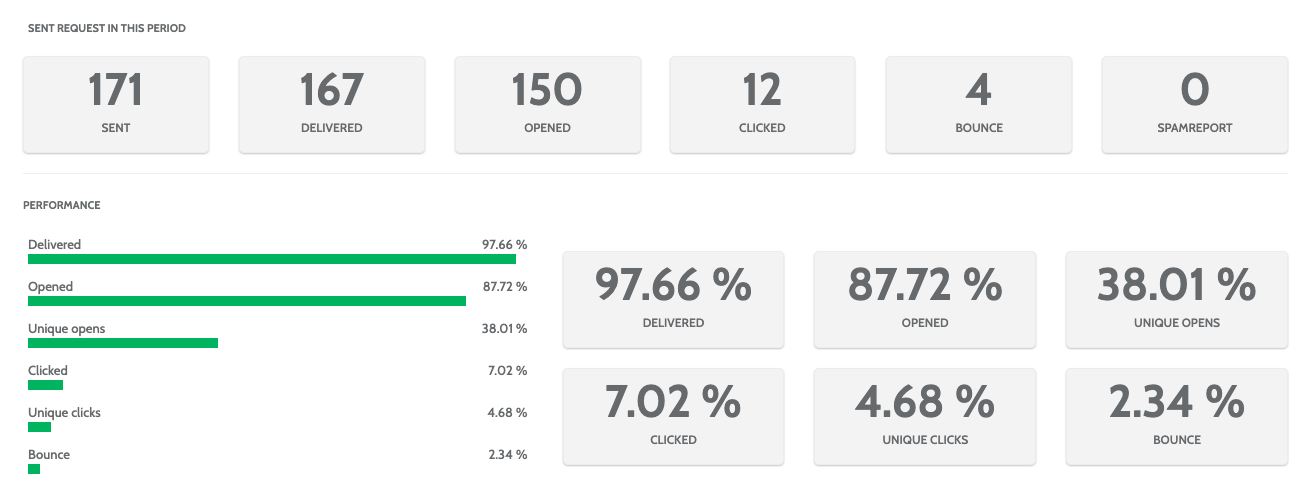
In the first part of the report, view a numerical and statistical breakdown of how your email performance, including Sent and Delivered rate, Unique Clicks and Unique Opens, and how many bounced or were registered as Spam by the receiver.
Further down in the you can view a graph of your emails development over time. Hover you cursor over the graph points to see the statistics of a certain date.
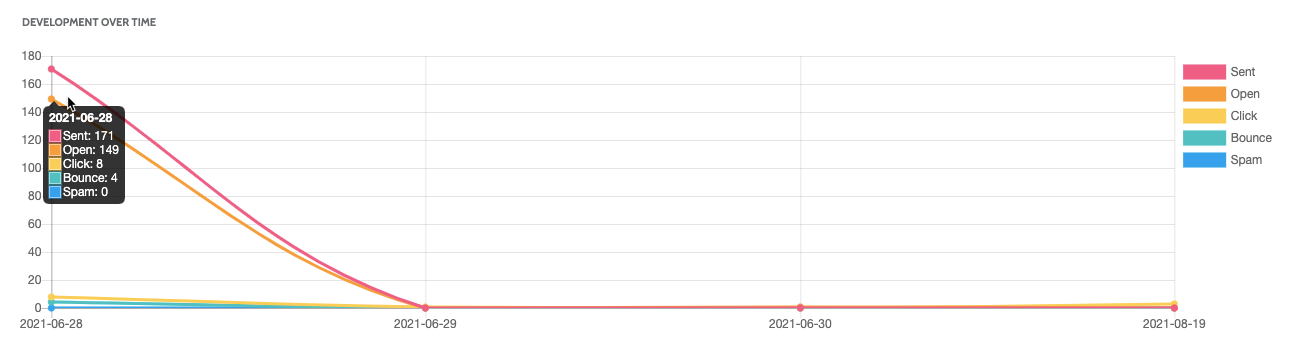
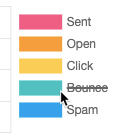
To edit the graph, click on the categories to the right to remove them from the view.
Under Details, view a detailed breakdown for Group 1 and Group 2 you included in filters.
Click each Group, or expand/collapse all to expand a list of the data in numerical and percentage form.
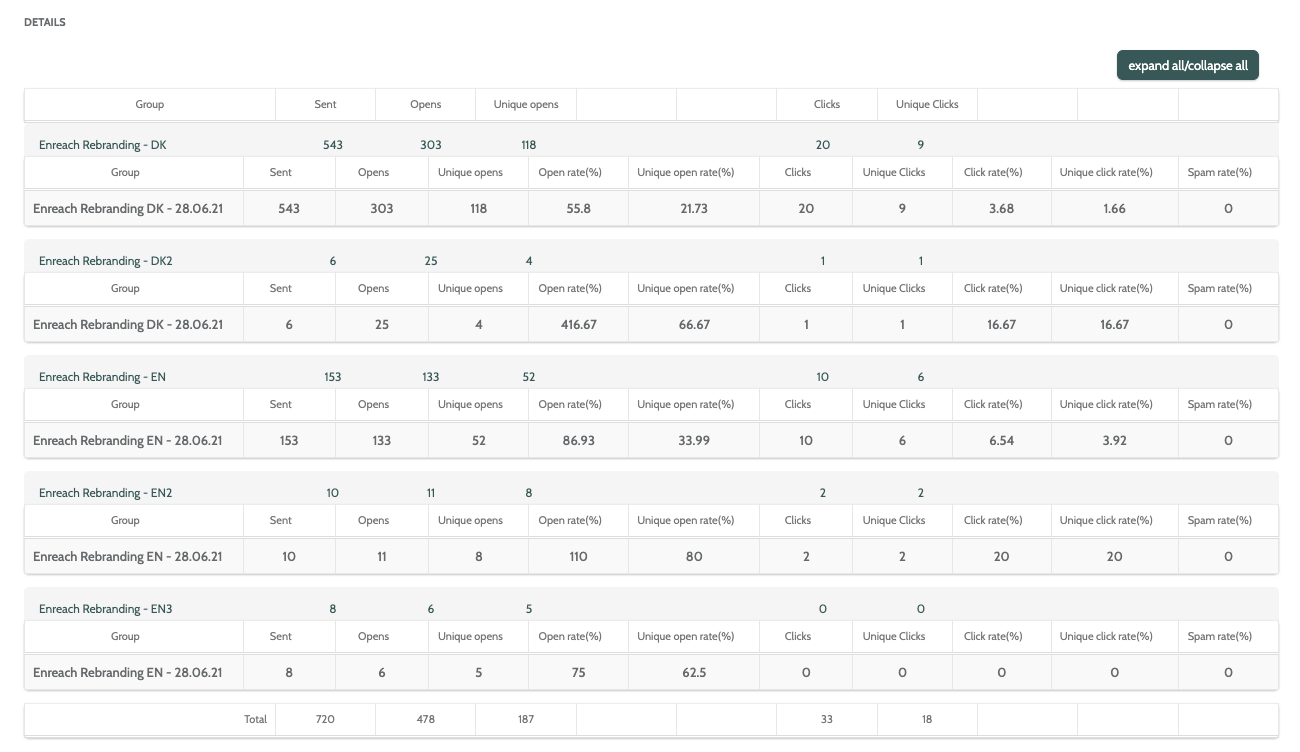
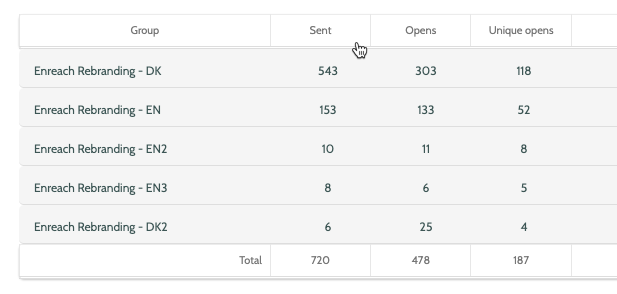
Click a column header to reorder the numbers from highest to lowest, to compare how your email activities compared to each other.
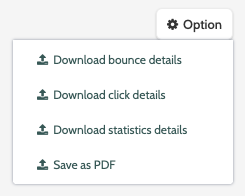
To export the details, click Option and choose between Download bounce details, Download click details, and Download statistics details to download a .CSV file to your desktop.
Click Save as PDF, enter a name in the pop-up window, and click Download. The PDF file will be saved to your desktop.
Heatmap reports
Heatmap reports will allow you to view essential statistics about how your email performed, including how many times it was opened or bounced, as well as giving you a visual indicator of how well each link performed, according to how many times they were clicked.
In the navigation page, begin by expanding the Filter menu, and selecting which email you want to view.
Next, expand the calendar menu and select a custom or preconfigured amount of time you wish to view the heatmap for.
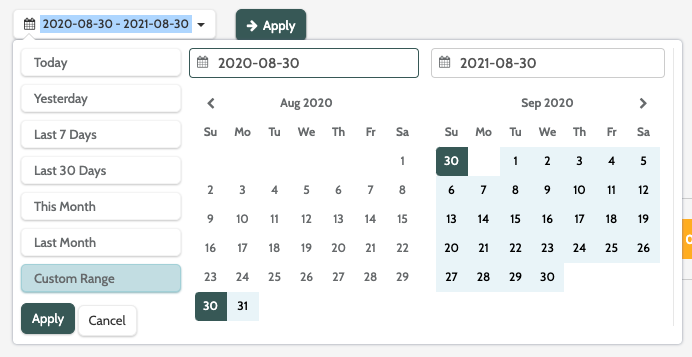
When you are done, click Apply.

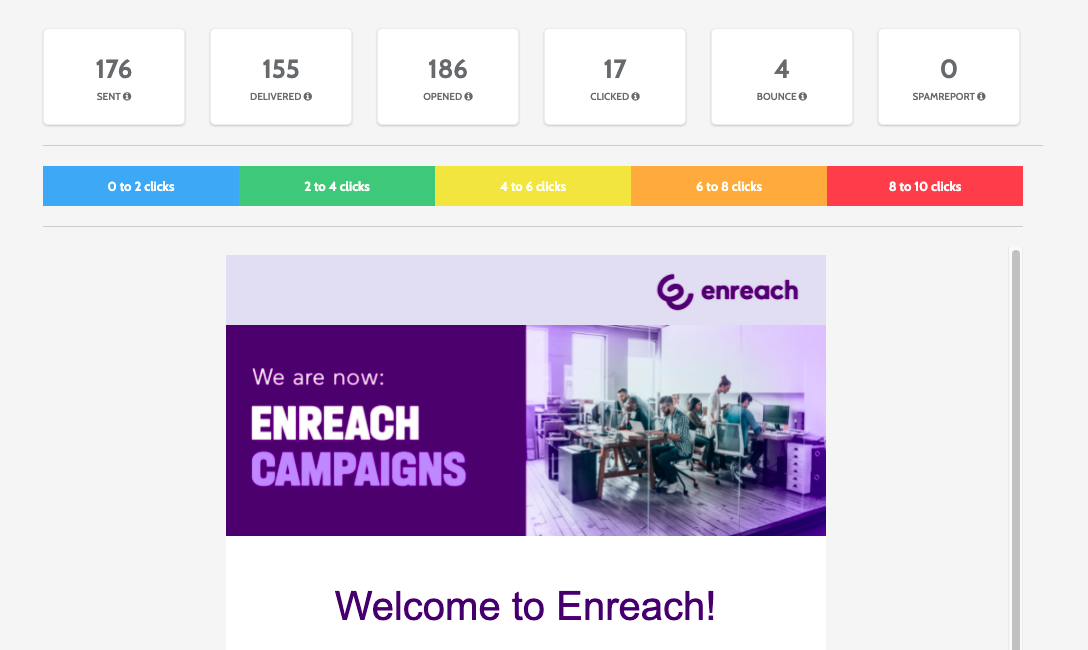
When the heatmap has been generated, it will display the statistics for the chosen amount of time, including how many times it was Sent, Opened, and Bounced.
Above the email is the legend. Each colour represents a number of clicks.
You may notice that the number of email opens in the email navigation page is not the same as the number in the heatmap.
👉Open in heatmap - number of unique opens
👉Open in navigation page - number of individual leads who opened your email.
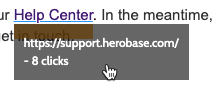
Each email link will be displayed in a colour that corresponds with the legend. Hover your cursor over a link to view the URL and see how many clicks it received,
A/B split reports
A/B split reports will allow you to generate reports on any email split testing carried out, and view detailed statistics of how each email performed.
In the navigation page you can view a list of all your previous split tests.
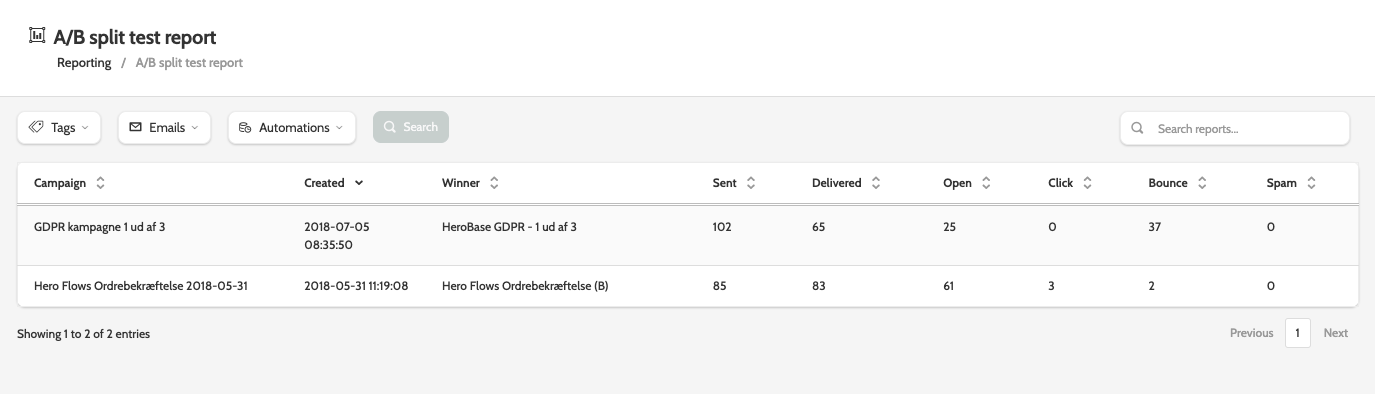
Use the search bar to search for a specific split test.
If you have a large amount of split tests, then use the filters to filter the view:
- Tags: select the relevant tags from the menu
- Emails: filter the report by any email activities used in the A/B split
- Automations: if the A/B split is in an automation, select it from the menu.
When you have chosen your filters, click Search.

Click on an email to be taken to a heatmap of your A/B split, and compare the winning email's statistics compared to the losing email.
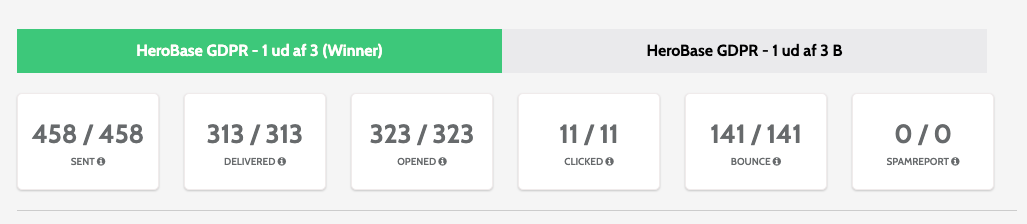
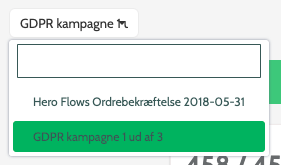
Change the view by selecting another A/B split email from the menu.
If the deadline hasn't passed but you wish to know which email is the more successful, click Option then Find winner now.